We recently updated our Tableau data dashboards with the most current available building permit and rental vacancy data. View the data along with a summary of the recent trends below.
Annual Building Permits Dashboard
Updated to include 2020 final data, covers 1980—2020
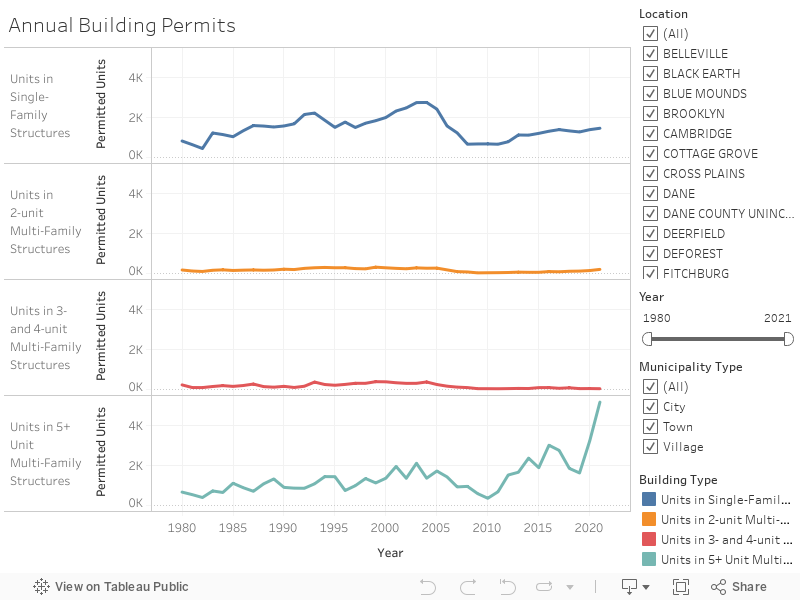
Single- and 5+ unit multi-family housing permits were higher in 2020 than the previous year, continuing the rising trend since the Great Recession. Large multi-family construction had its best year in the past 40 recorded years, topping the 2016 record by over 200 units. Total units produced in 2020 was up significantly (+1,700) from 2019. This stops a three-year trend of declining total annual units produced. Total unit production for 2020 was once again at comparable levels with the boom from 2000 to 2005. Multi-family construction accounted for 70% of units produced last year and has accounted for the majority of new units since 2012.
Monthly Building Permits Dashboard
New dashboard, includes 2020 final and 2021 preliminary data, covers 1997 to present
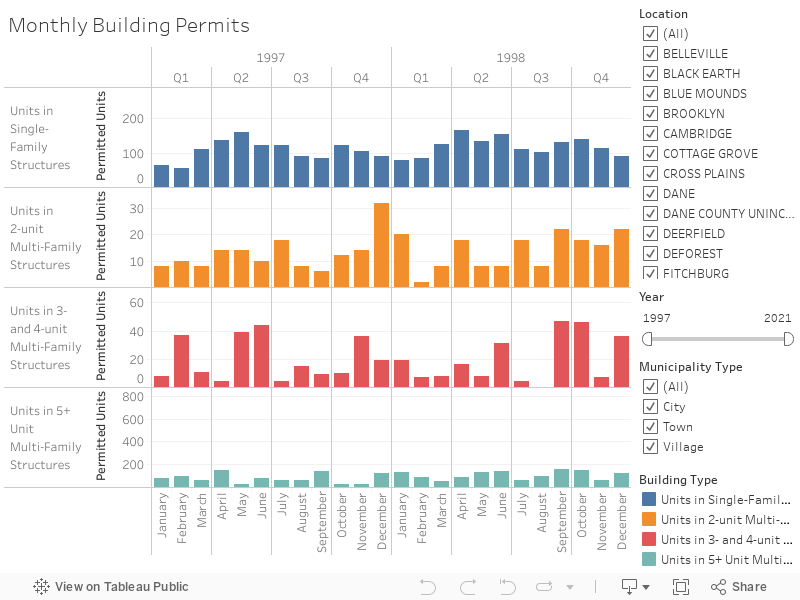
Single-family unit production is down in the first half of this year based on the preliminary reporting to HUD. Multi-family unit production is down the first half of this year as well. This could turn around in the second half of the year. Multi-family unit production in Q3 of last year was very, very high accounting for three quarters of all units produced between July and September. Single-family production was also strong through the end of 2020. However, what we may see in the second half of this year are delayed effects of COVID-19 as housing that was in the pipe when the pandemic began gets built out.
Monthly Rental Vacancy Dashboard
Updated to include Q1 2021 data, covers 2003 to present
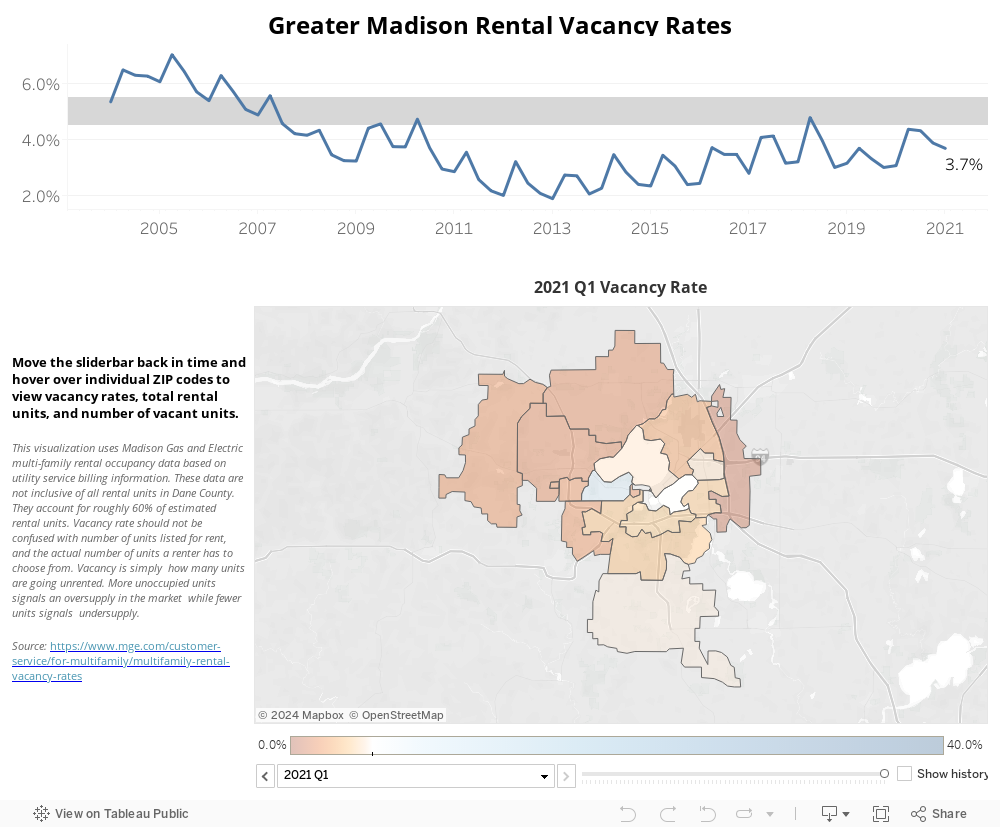
ZIP 53705 has remained above 7% vacancy for the past 4 quarters. This level of vacancy is uncharacteristic for recent history. But it is not particularly worrisome. If anything, this is a healthier vacancy rate than the sub-five percent levels seen almost everywhere else in recent years. This ZIP Code has lots of student housing, so it is not uncommon to see higher vacancy rates there during parts of the year. COVID-19 and disruptions to in-person instruction are likely to blame for the prolonged period of relatively high vacancy.